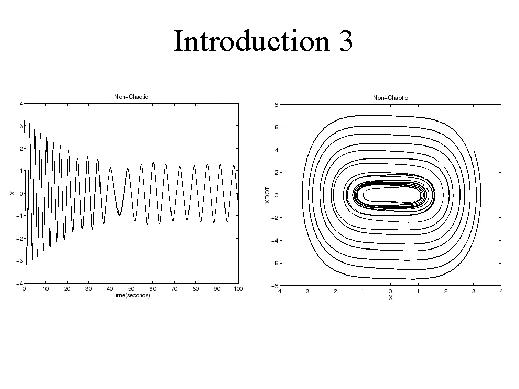
If I give some initial condition, you can see that the trajectories for the two different initial conditions keep on tracking each other. There is a small difference initially and the small difference will persist. One way of analyzing this system is to plot what is called the phase plot where we plot the derivative versus the variable itself. In a phase plot for a non-chaotic system it looks like a set of circles.