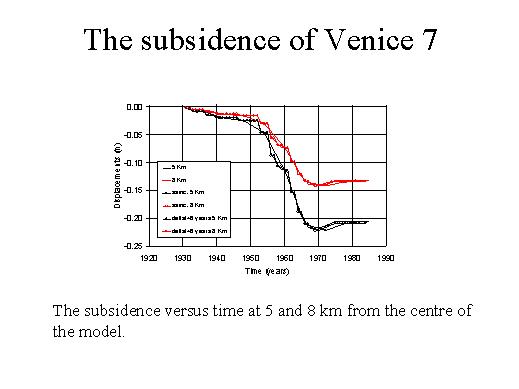
Here you see there are step values, steps in the diagram that is due to the pumping schedule and the model which used a asynchronous method reproduces quite nicely this behaviour.
| Here we show
the subsidence in Venice. Actually the centre of the model is in the industrial
town, where the production of the water pumping occurred and the subsidence
of interest was in Venice. We used two particular points at 5 and 8 kilometres
form the centre and these are compared very well to the measured values.
Here you see there are step values, steps in the diagram that is due to the pumping schedule and the model which used a asynchronous method reproduces quite nicely this behaviour. |
|