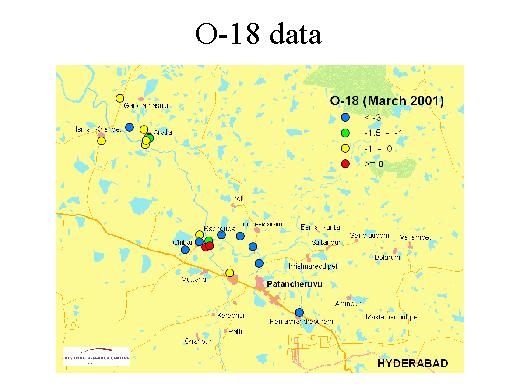
I think that from this graphic, one can learn that the well upstream are fed with waters, which are upstream, close to the meteor or to the meteor waterline to the local precipitation line which was not too much under evaporation processes before. Exceptions are only the samples of the surface water, close by the affluent. However downstream in the area of Arutla the majority of the waters is obviously enriched in O-18 caused by evaporation processing in the course of the Nakkavagu river and due to irrigation processes, as I mentioned before.