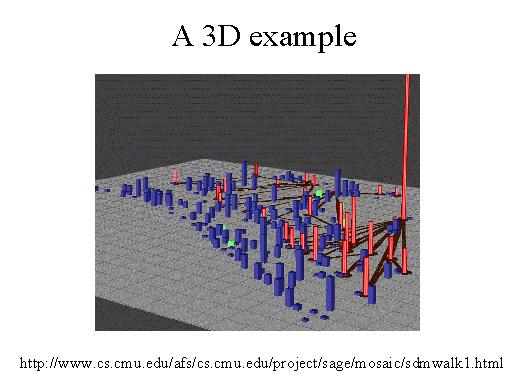
In this slide, you can see a recent example of a 3-D visualization, where the problem is to visualise a number of geographical locations in case of an emergency. It is a rescue operation, so you have mapping on boxes to indicate the deposits where materials are stored. You have mappings on cylinders to indicate the destinations that have to be reached, and then you have a mapping on the height of the different geometrical objects to indicate how many materials are there, and then you have mapping on the geographical map to indicate where in space the different storage deposits and destinations are. And these black lines indicate the connecting roads among the destinations and the origins of the materials. And this example poses the question of the exploitation of 3-D in information visualization, and there is a fierce debate about the use of 3-D, because there are both pros and cons in the adoption of 3-D for an information visualization.