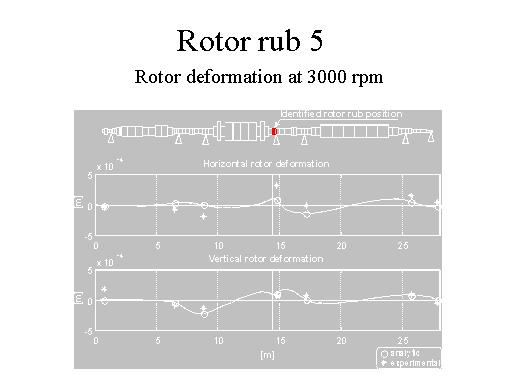
| In order to have a further checking, in this chart we reported the vertical and horizontal deformation of the rotor at 3000 rpm. In the chart, the stars, which represent the experimental reference, are compared with the continuous line, which is the simulated value. It is possible to say that the trend is very close each to other. |
|