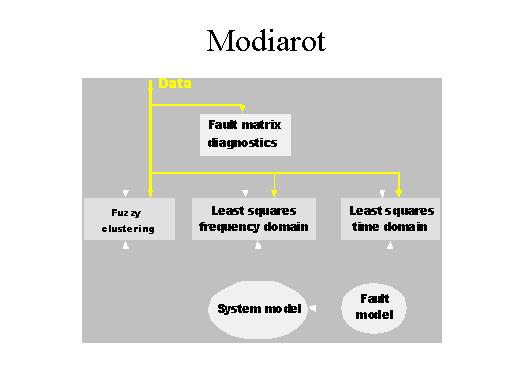
The flow chart shows that the experimental data of the system can go to a first phase with diagnostics made by a qualitative analysis which can give some information about the type of the fault occurred in the machine.
Then the data can be studied by analytical tools to have a quantitative identification of fault.
Many tools can be used to do that. In the chart are shown the fuzzy clustering, the use of the least squares fitting in the frequency domain and of the least squares fitting in the time domain.
Another part of the identification procedure is the definition of the fault models and these fault models have to be included in the model of the system.