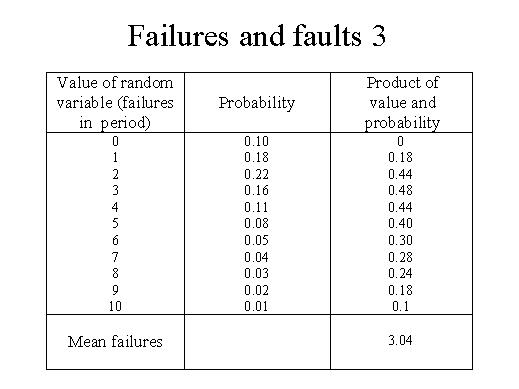
| The table illustrates a typical probability distribution of failures that occur within a time period of execution. Each possible value of the random variable of number of failures is given along with its associated probability. The probabilities, of course, add to 1. Note that here the random variable is discrete, as the number of failures must be an integer. We can also have continuous random variables, such as time, which can take on any value. Mote that the most probable number of failures is 2 (probability 2.2). The mean or average number of failures can be computed. Multiply each possible value by the probability it can occur and add all the products, as shown. The mean is 3.04 failures. |
|